AudioSpending a lot of money for little gain |
Version | v0.0.5 | |
|---|---|---|---|
| Updated | |||
| Author | Phillip Lane | License | MIT |
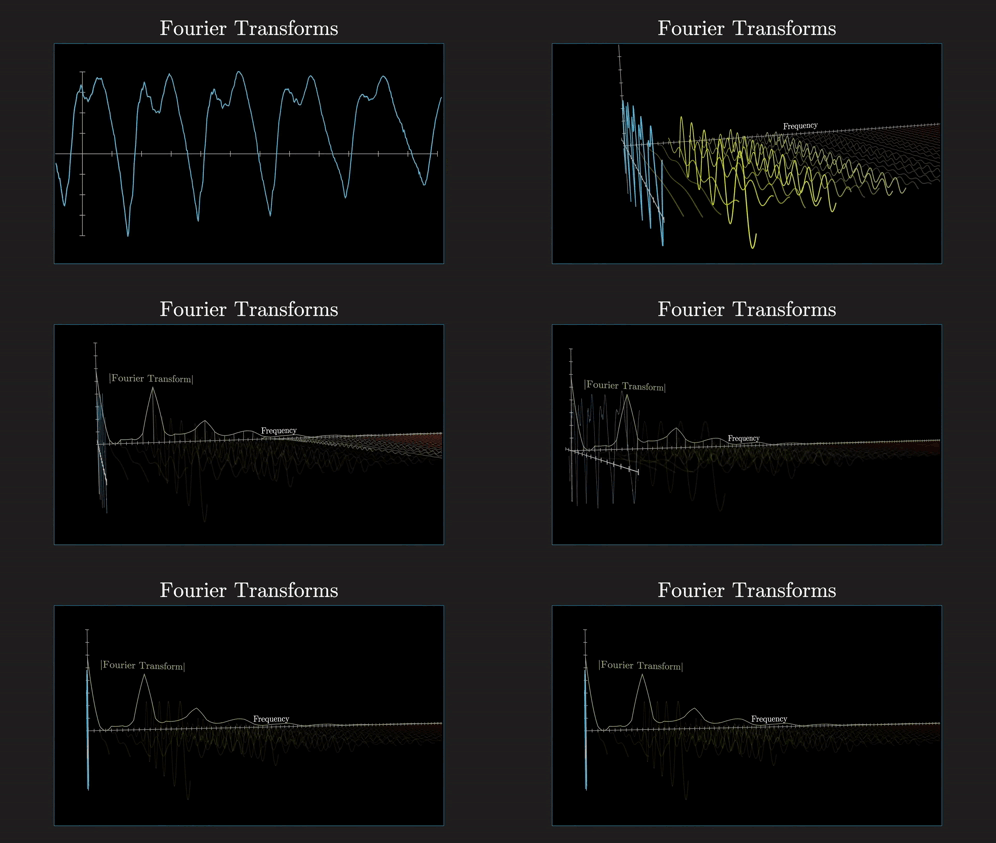
All sounds that you hear are produced with an infinite sum of sine waves at different frequencies and amplitudes added together. You may know this as a form of the Fourier theorem. By applying a Fourier transform to a sound wave, we can obtain its constituent sine waves.
The human ear can, on average, only hear tones between 20 Hz through 20 kHz, which means that when we want to reproduce sound for human listening, we can usually ignore frequencies beyond 20 kHz.
Some people have “golden ears” (one person who comes to mind is Cameron / GoldenSound from the Headphones.com team) who can hear beyond 20 kHz. This means that they may be able to hear the rolloff filters on a given DAC. This may be a part of why some people claim that not all well-measuring DACs are transparent.
When considering sound quality of a headphone, IEM, or loudspeaker, we often consider its frequency response as one of, if not the most important metric to consider. The frequency response of a transducer can be understood as the Fourier transform of transducer while playing white noise. White noise is a sound signal containing all frequencies at equal loudness, meaning that if the transducer is perfectly replicating its input, we should get a flat frequency response as an output.
… I really wish it was that simple.
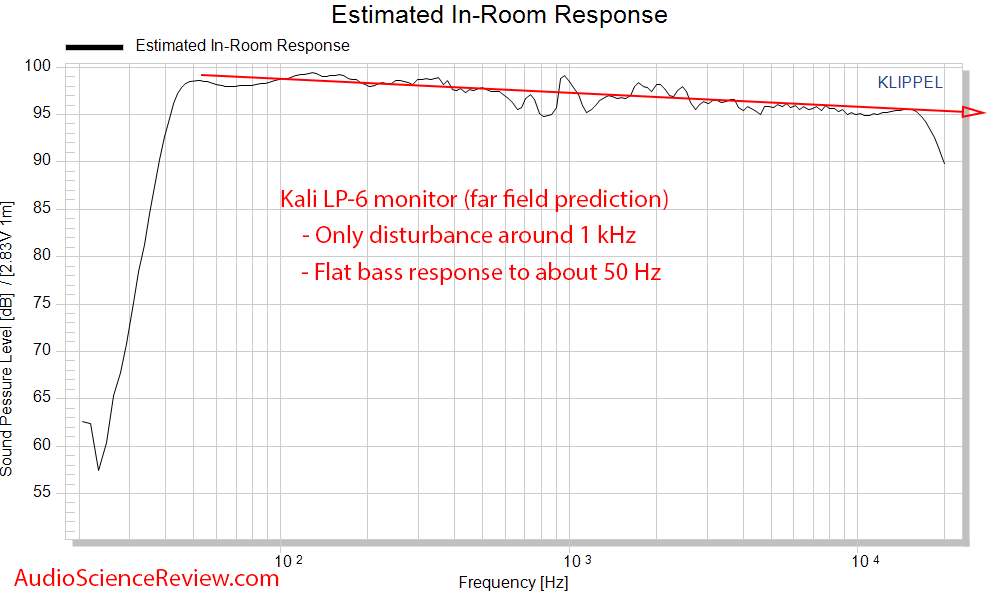
Well, it sort of is for loudspeakers. Here is a frequency response graph of the loudspeakers I personally use, the Kali LP-6 V2:
For headphones and IEMs, however, things get a little bit more complicated.
Behold, one of the biggest issues to measuring sound quality for headphones and IEMs:
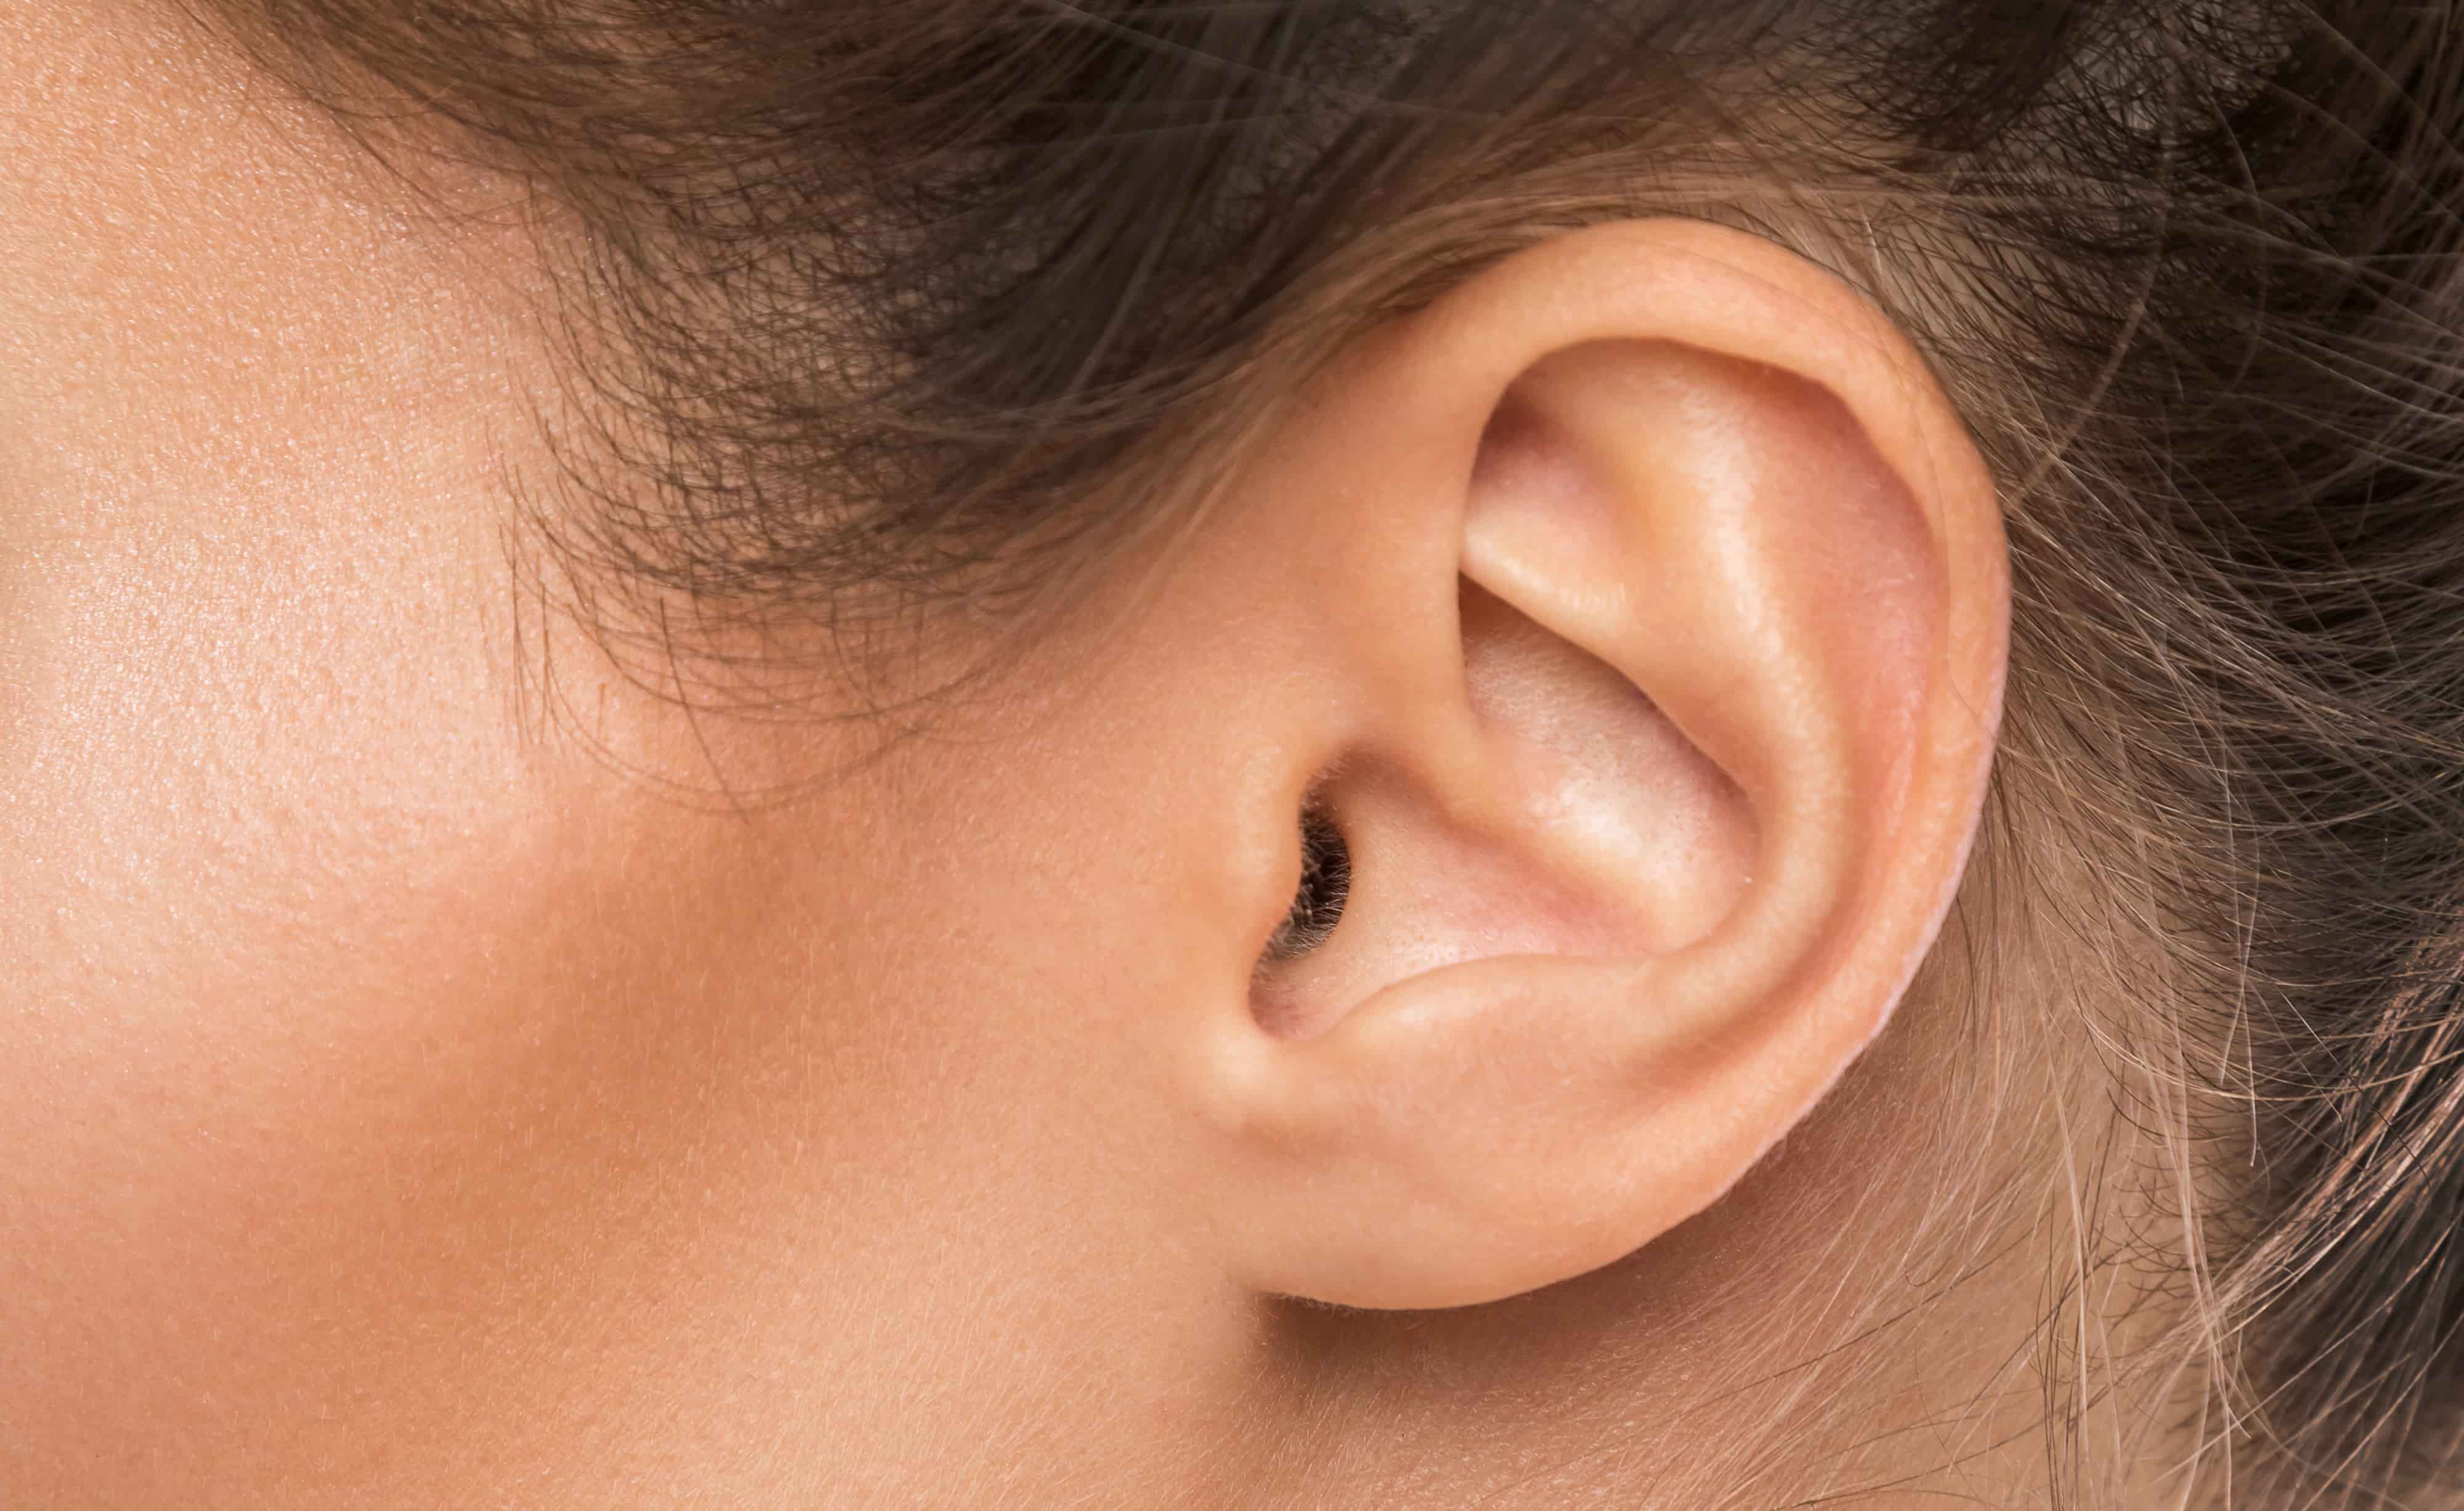
As humans evolved, we evolved pinnas, also known as the outer ear. Our ears are designed to actually amplify a number of frequencies, mostly centering around 3-4 kHz. These frequencies were likely very important from an evolutionary perspective, so we evolved to amplify those frequencies before they even reach our eardrum. We measure headphones and IEMs not on a flat plate, but rather, we simulate the pinna to more realistically capture the environment in which headphones and IEMs are worn.
We can actually create a frequency response measurement of our ears by performing a sine sweep and measuring the frequency response at the eardrum. This particular frequency response is called a head-related transfer function (HRTF). If we play the sine sweep in a way that it’s not localized (i.e., it seems to play equally loudly from every direction at once), then the sine sweep is considered to have been played in a diffuse field, resulting in a diffuse field head-related transfer function (DFHRTF).
Everyone’s DFHRTF is different, which makes things complicated. Since measuring on human ears is quite difficult, we use measurement rigs instead, like the B&K 5128 or the MiniDSP EARS 2.
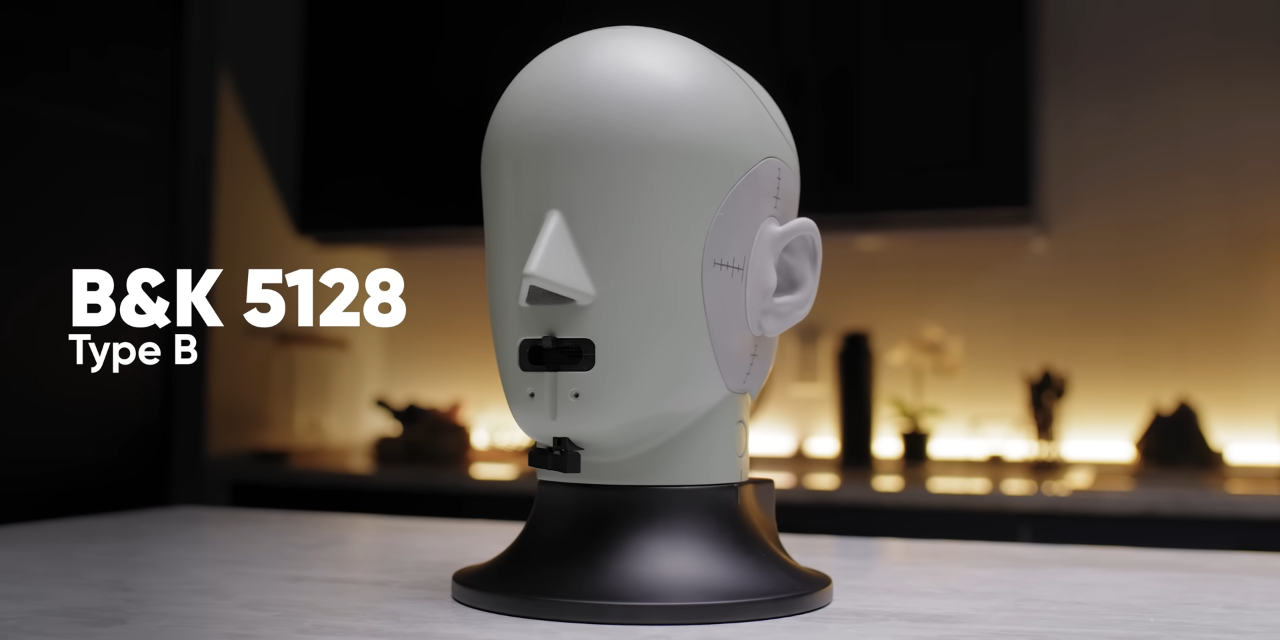
Of course, measurement rigs themselves have their own DFHRTFs:
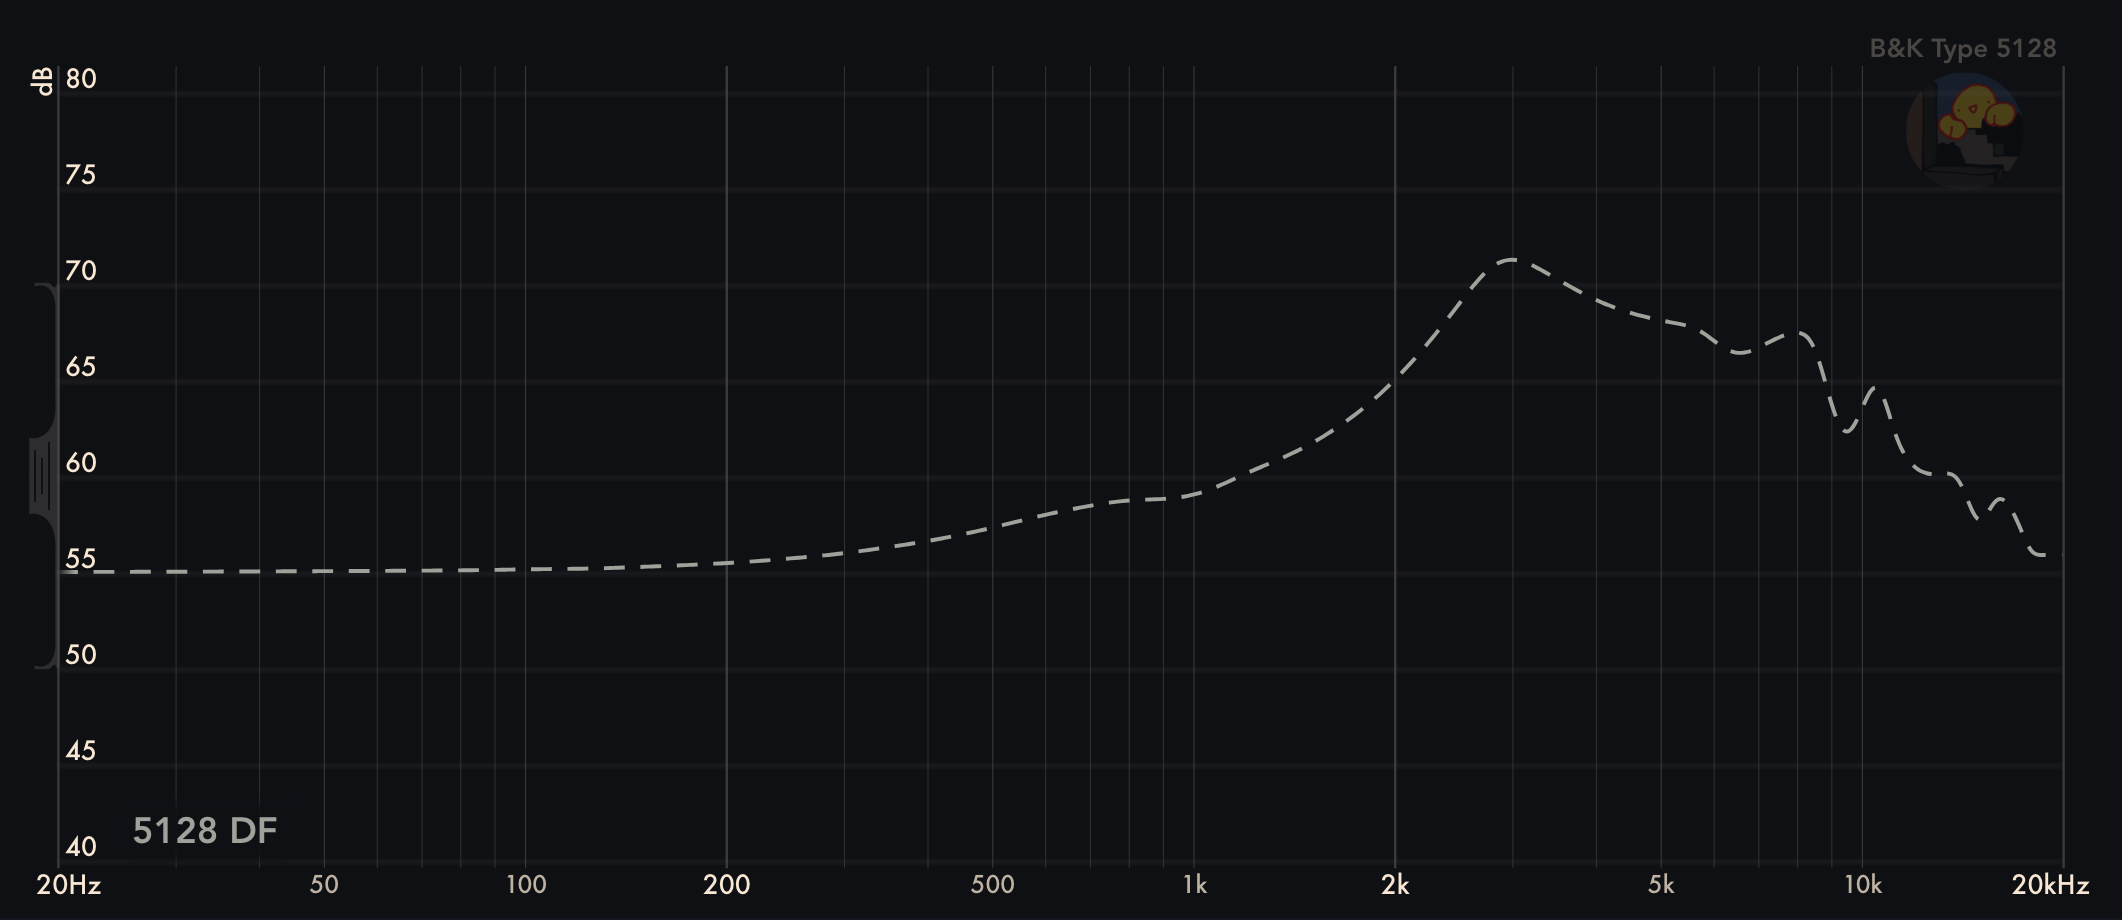
Feeling overwhelmed yet? It gets even crazier. Research has shown that humans generally find a pure DF frequency response to be too bright (i.e., having too much treble and lacking bass and mids). Typically, we don’t compare headphones or IEMs to pure DF, but rather, a tilted DF. A common tilt is -1 dB per octave, or -10 dB across the full spectrum that we care about. Furthermore, as has been said, not everyone’s HRTF is the same. There is quite a bit of variance, especially in the treble above 2-3 kHz.
This leads to a very difficult problem for using a measurement rig’s DFHRTF as a baseline for how headphones should sound. The current state-of-the-art is to use tilted DF with preference bounds. Then, we compensate the measurement, which means subtracting the DFHRTF from the headphone measurement. This is opposed to a raw measurement, which directly presents the frequency response of a headphone at a simulated eardrum.
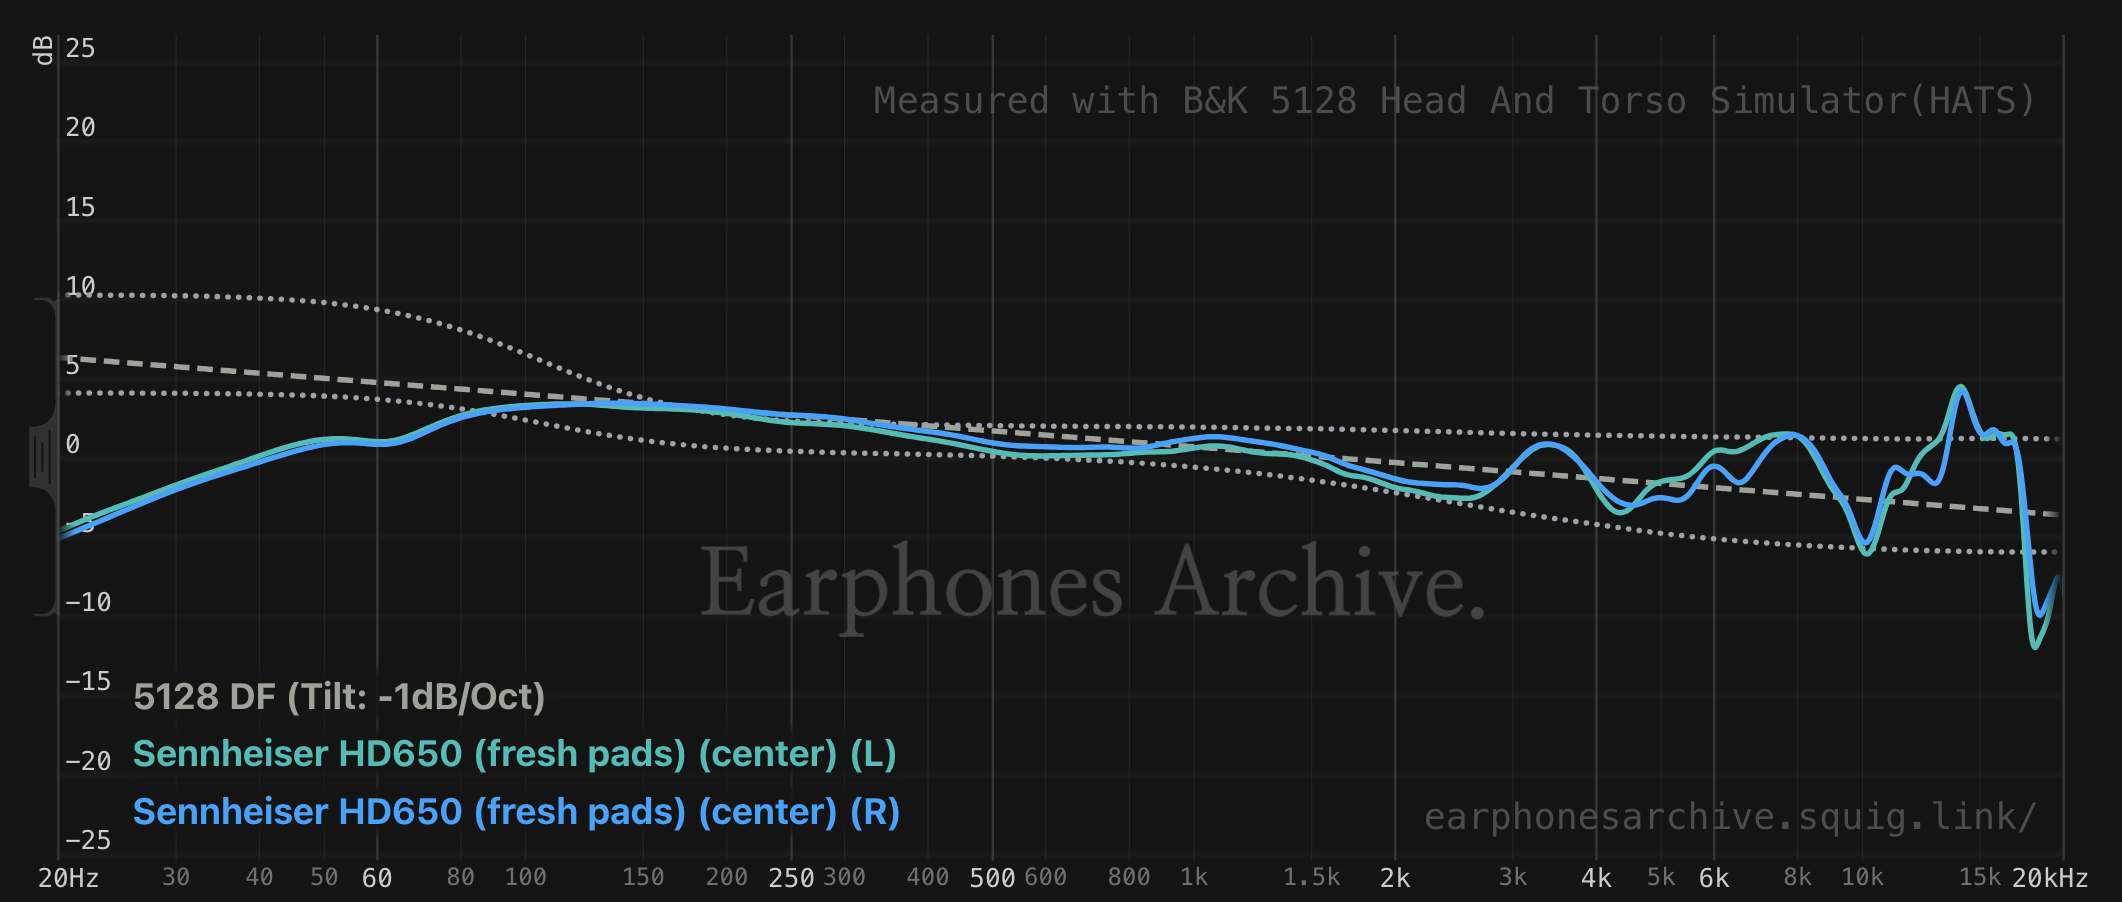
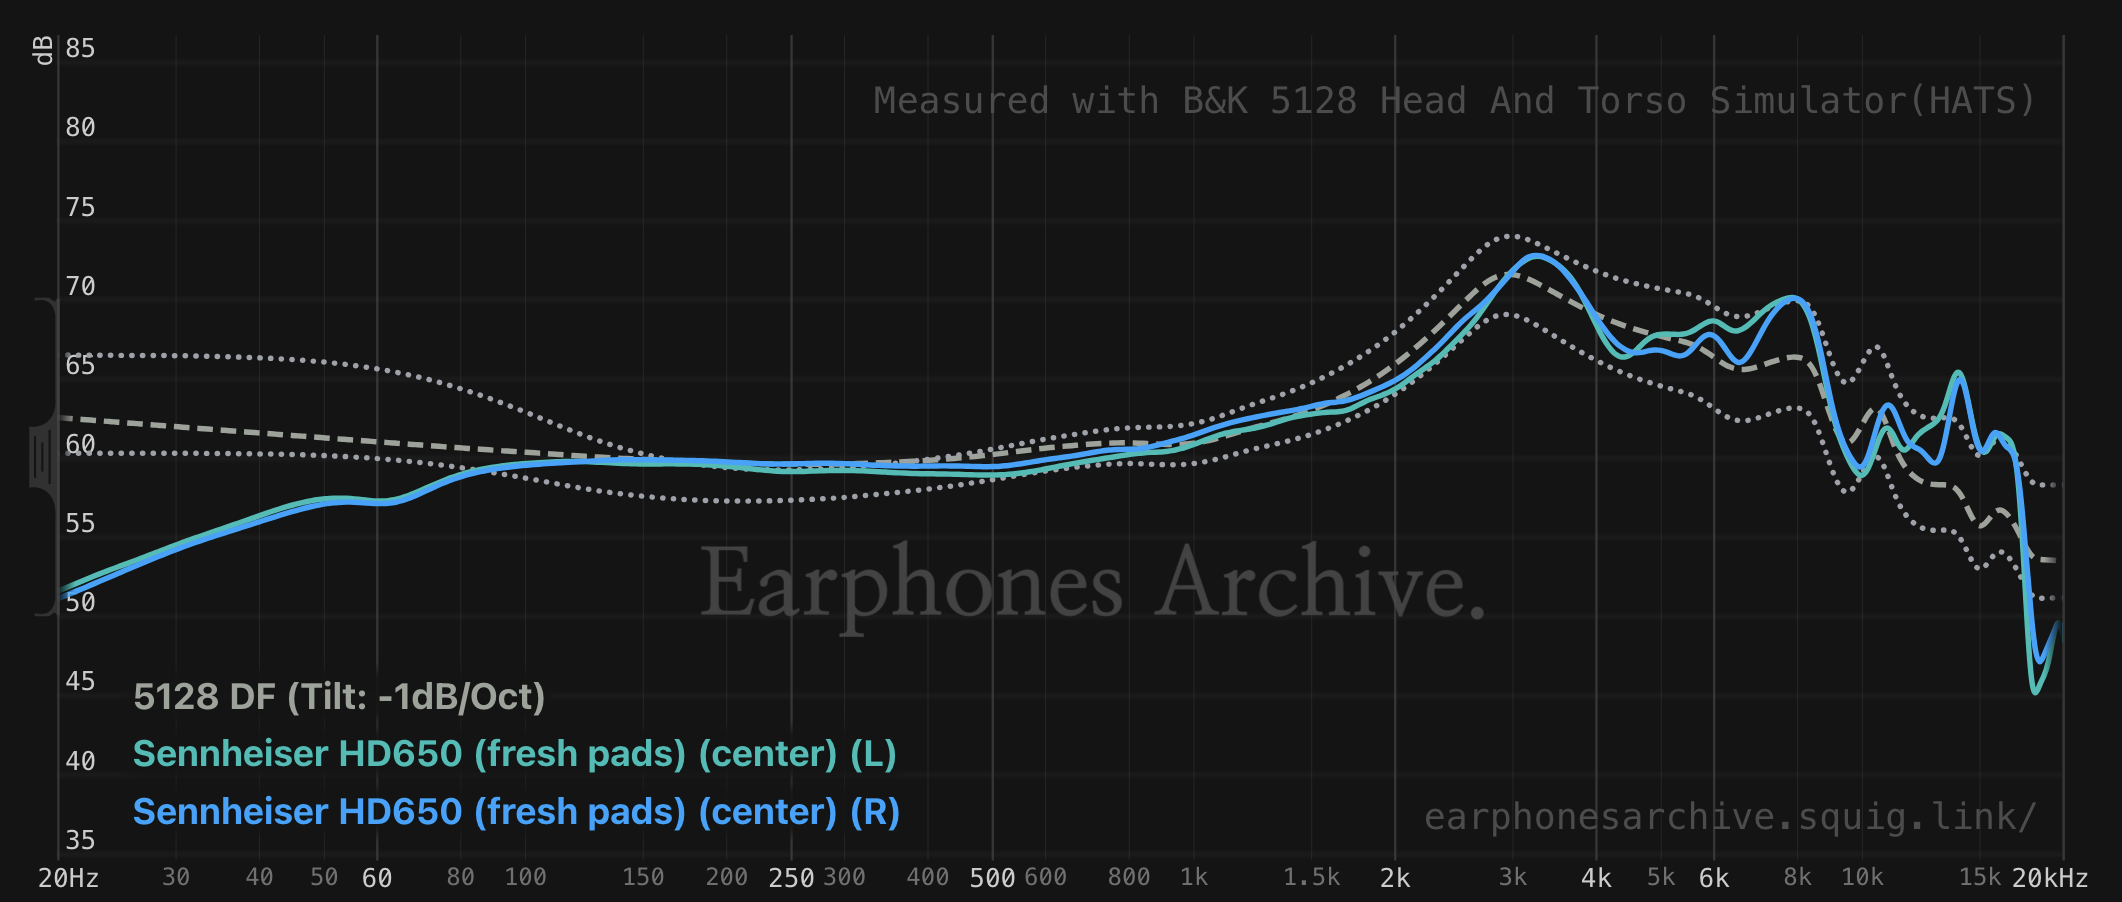
As a general rule, measurements that fall within the preference bounds are more likely to be considered as sounding “neutral” to most listeners. Headphone measurements which fall outside of the preference bounds are more likely to be considered as sounding “wrong” and “bad,” though sometimes you can end up with a result that sounds “colored,” “energetic,” or “fun.”
None of this even takes into account preference. Some people prefer more bass and less treble, some people prefer less bass and more treble, and some people prefer lots of bass, lots of treble, and a scoop in the mids.
The preference bounds in the previous section help account for this, but those are bounds around a DFHRTF to try to capture the range of preferences that one might have. As an alternative, some people prefer to compare headphone measurements to preference curves rather than a DFHRTF. The most common ones come out of the Harman research and are collectively known as the “Harman targets.” Some reviewers (such as rtings and Crinacle) have created their own preference curves.
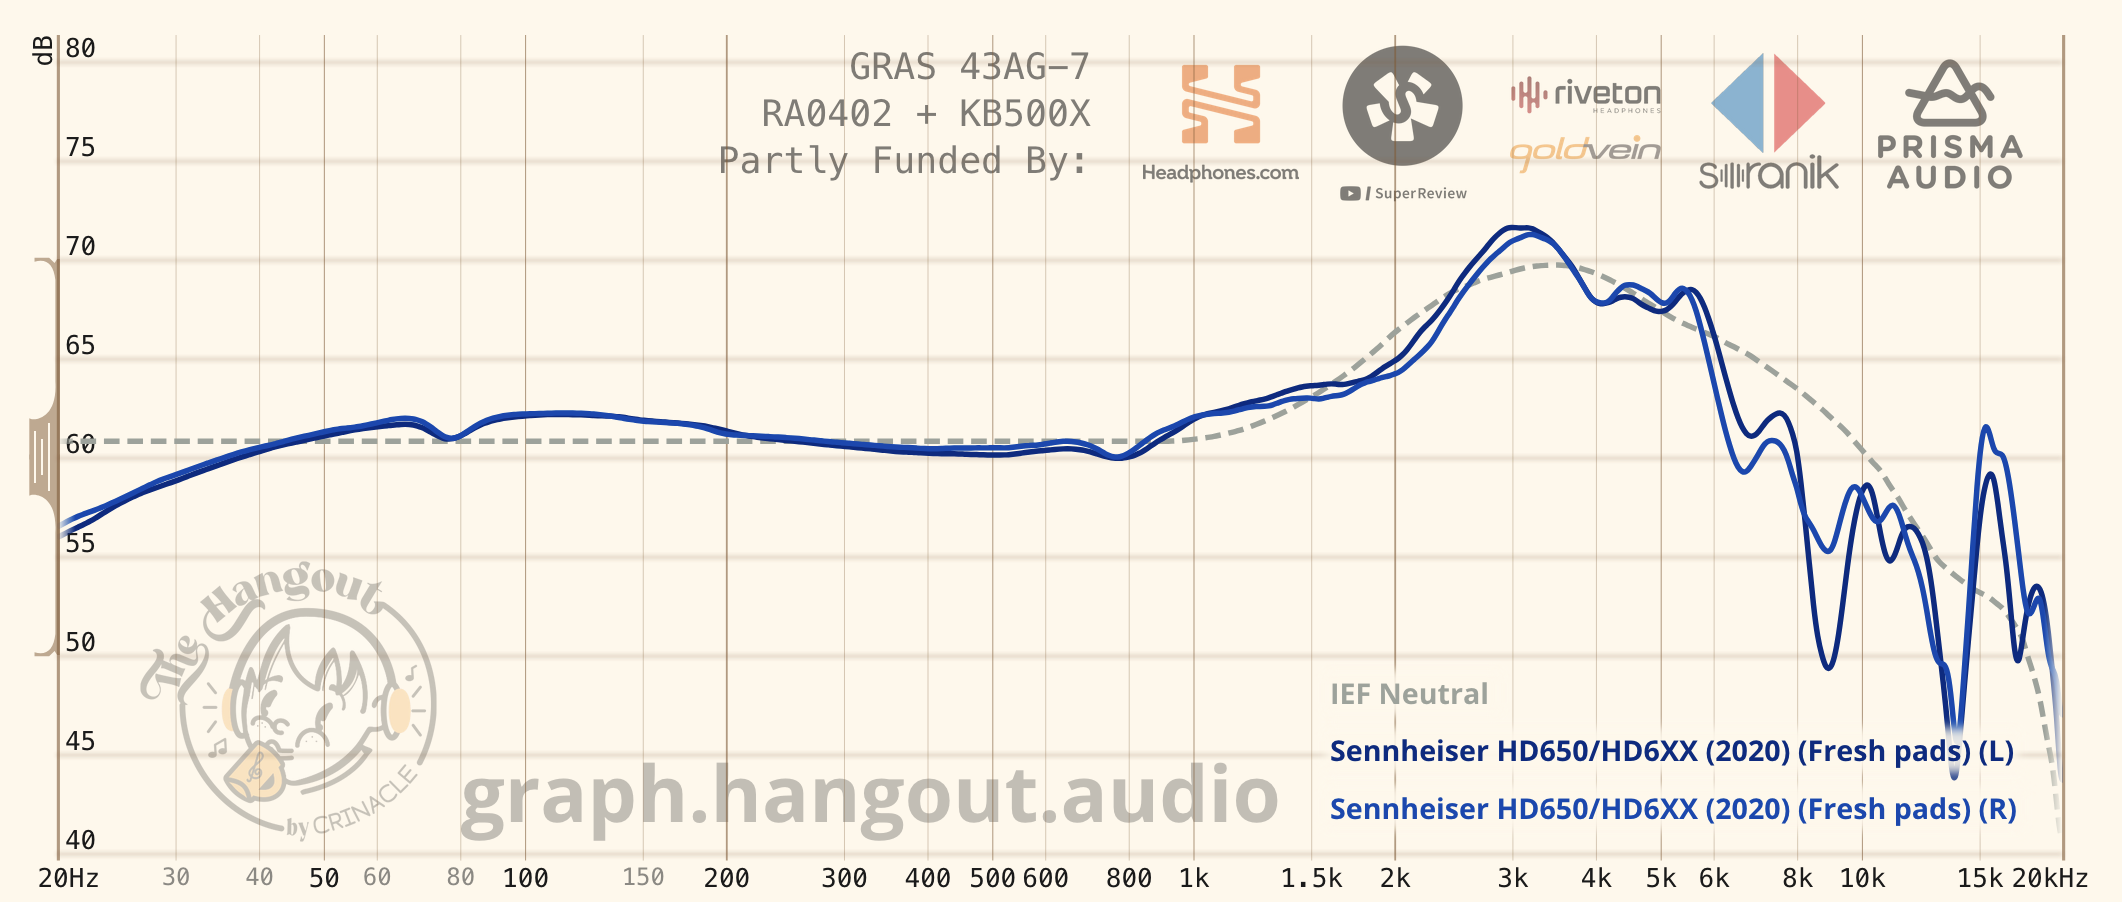
I won’t speak much about preference curves, because most of the time, I’d much prefer using DFHRTF with preference bounds. Nevertheless, there are a few comments I’d like to make.
First is that preference curves are tied to specific rigs. For instance, the 2018 Harman Target was developed on a GRAS rig, so it would be incorrect to use the 2018 Harman Target as a point of comparison for B&K 5128 measurements. Second is that it’s important to understand a reviewer’s preference curves when analyzing graphs using them. Preference curves can be whatever the reviewer wants. In my humble opinion, this makes most preference curves useless for analyzing real measurements.
Headphones and IEMs create minimum-phase systems. I encourage you to skim the Wikipedia article I’ve just linked, because I’m only going to get into the ramifications on audio.
Headphones and IEMs being minimum-phase systems means that, in the absense of factors like distortion, sound quality can be entirely described by a headphone’s frequency response. This may be controversial to some audiophiles, but this is our current best understanding of sound. Audiophiles often use terms like “bright,” “dark,” and “warm,” to describe the tonal balance of a headphone. It’s easy to see how these map onto frequency response: bright headphones have a lot of treble, dark headphones have recessed treble, and warm headphones have elevated lower mids. Audiophiles also use terms to describe so-called technicalities of headphones, such as “attack,” “decay,” “detail retrieval,” “dynamics,” and so on. It is not so obvious how to map these terms onto frequency response, but recent research has shown that we can indeed introduce these “intangibles” into headphones solely with equalization software (which changes the frequency response of headphones).
With that said, hopefully you can see why I spent a good amount of this page describing frequency response measurements. While other types of graphs like waterfall graphs are pleasing to look at, the only measurement you need is a frequency response measurement.
Unfortunately, none of this is immune to the simple fact that we usually measure headphones on measurement rigs, and a measurement rig is different than a human head. Furthermore, even if we were to measure a headphone on a human head using in-ear microphones (as some reviewers have begun doing), this does not change the fact that your head is different from my head. All of this means that your HRTF is different from my HRTF is different from a measurement rig’s HRTF. If there was a machine that could allow you to hear using my eardrums, you would find that headphones literally sound different on my head than they do on yours.
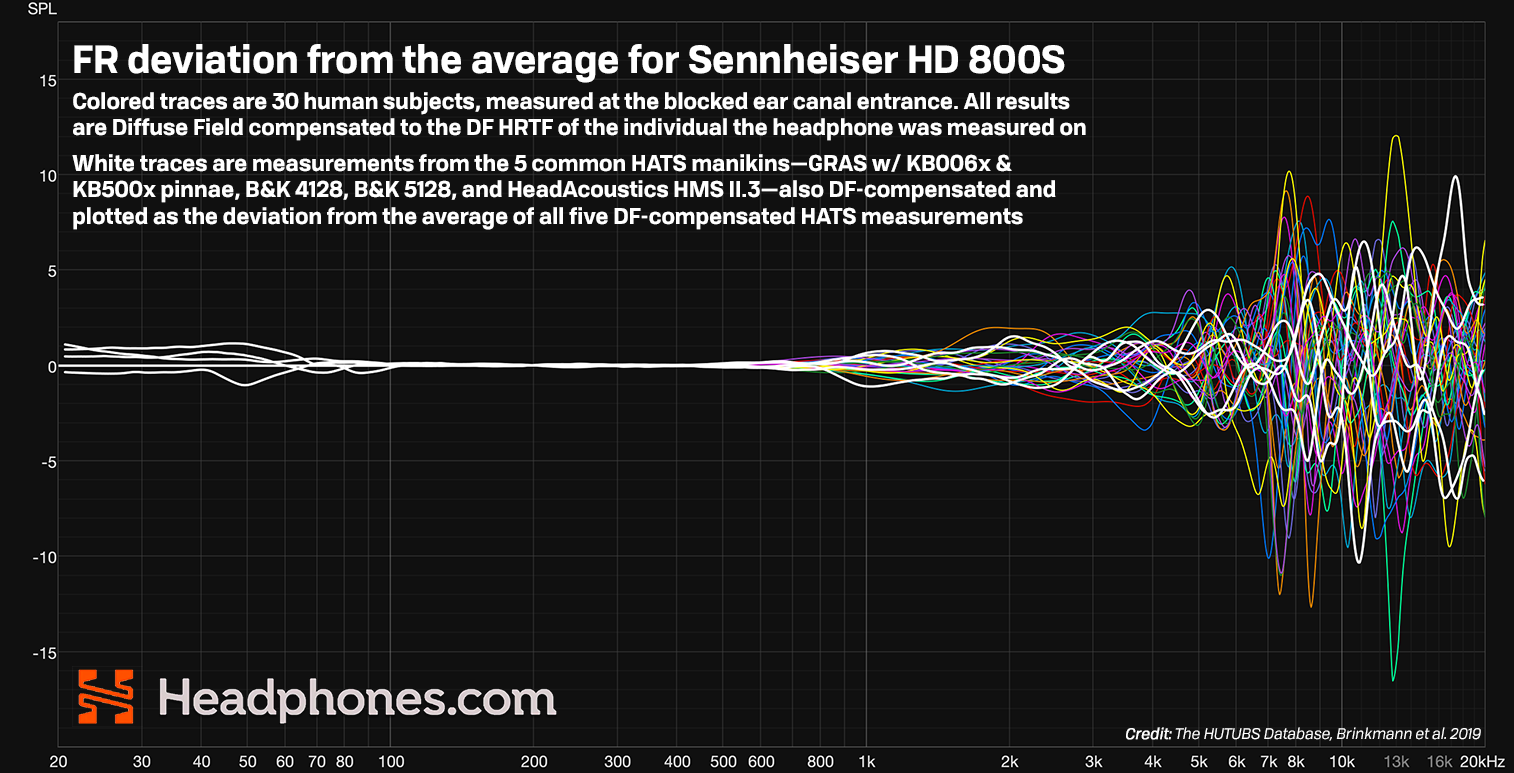
Simple fact is, we all hear a little bit differently. That’s why frequency response measurements are helpful (in the sense that they are better than nothing), but nothing is a total substitute to hearing a headphone yourself with your own ears.
So get out there and listen to some headphones!
There are three main steps of the sound reproduction process for digital audio.
Digital
signal  ┌───────┐    ┌─────────┐    ┌──────────┐
───────►│  DAC  │───►│Amplifier│───►│Transducer│──────►
        └───────┘    └─────────┘    └──────────┘ Sound
                                                 waves
In the following sections, I’ll talk about each of these steps and how it works.
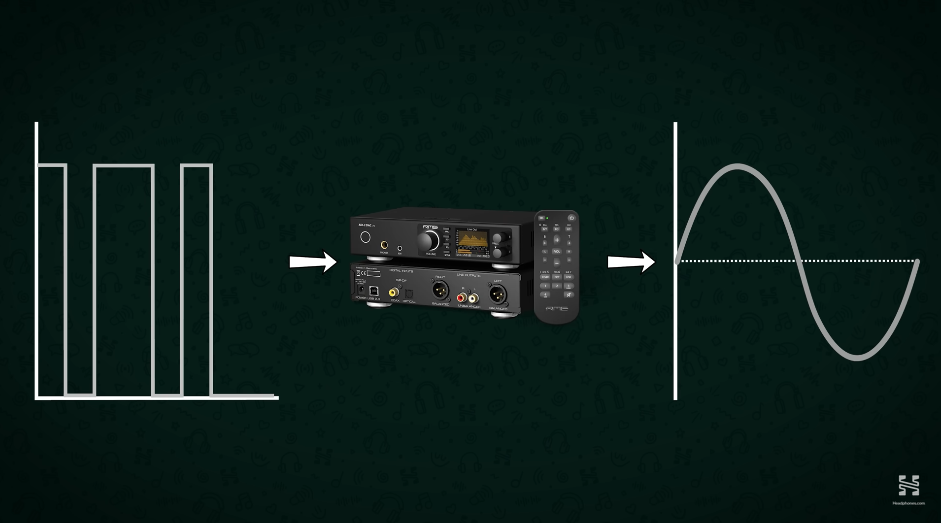
Your computer stores audio in digital audio files, such as MP3, FLAC, or WAV files. Digital signals consist of only 1s and 0s, and digital audio files encode information as binary. However, all downstream audio equipment require an analog signal, which is a continuous, smooth signal. Digital-to-analog converters, or DACs, are responsible for turning a digital signal to an analog signal.
Digital audio data is stored as samples. In essence, when recording audio, we sample audio at regular intervals (such as 192 kHz, or 192,000 samples per second) and measure the sound pressure level as a percentage of the maximum volume level.
       ╱ ╲             ╱ ╲
     ╱     ╲         ╱     ╲
   ╱         ╲     ╱         ╲
 ╱             ╲ ╱             ╲
─────────────────────────────────
         100%              100%
      66% │ 66%         66% │ 66%
   33% │  │  │ 33%   33% │  │  │ 33%
 0% │  │  │  │  │  0% │  │  │  │  │
─┴──┴──┴──┴──┴──┴──┴──┴──┴──┴──┴──┴─
The number of samples we take per second is called the sample rate. The other important number is the bit depth, which tells us how many bits to record the percentages. Take, for example, a bit depth of 16. In this case, we use a 16-bit number to represent the percentages. The smallest 16-bit number is 0, and the largest 16-bit number is 2^16-1, or 65535. To convert our percentages, we multiply the percentages by the largest 16-bit number to get the value of a sample. In the case of the above triangle wave, we have the following samples:
After encoding these numbers to binary, we get the following bitstream for the above figure of a triangle wave:
        0%                 33%                66%                100%
┌────────┴────────┐┌────────┴────────┐┌────────┴────────┐┌────────┴────────┐
 00000000 00000000  01010100 10000100  10101000 11110101  11111111 11111111
        66%                33%                0%                 33%
┌────────┴────────┐┌────────┴────────┐┌────────┴────────┐┌────────┴────────┐
 10101000 11110101  01010100 10000100  00000000 00000000  01010100 10000100
        66%                100%               66%                33%
┌────────┴────────┐┌────────┴────────┐┌────────┴────────┐┌────────┴────────┐
 10101000 11110101  11111111 11111111  10101000 11110101  01010100 10000100
Assuming we’ve sampled 44,100 times per second (or 44.1 kHz), that means that we’ve captured a triangle wave oscillating at about 7.3 kHz. This is a pretty terrible sound that immediately made my tinnitus flare up. Take a listen for yourself. We would say, then, that our bitstream is a 16-bit 44.1 kHz audio track, commonly known as CD quality.
The job of the DAC is to turn the above bitstream back into that awful sounding triangle wave.
Here are some articles on headphones that I recommend reading for people interested in audio:
I am working on compiling a ranked list of all of the headphones that I’ve tried.